Highlight Panel
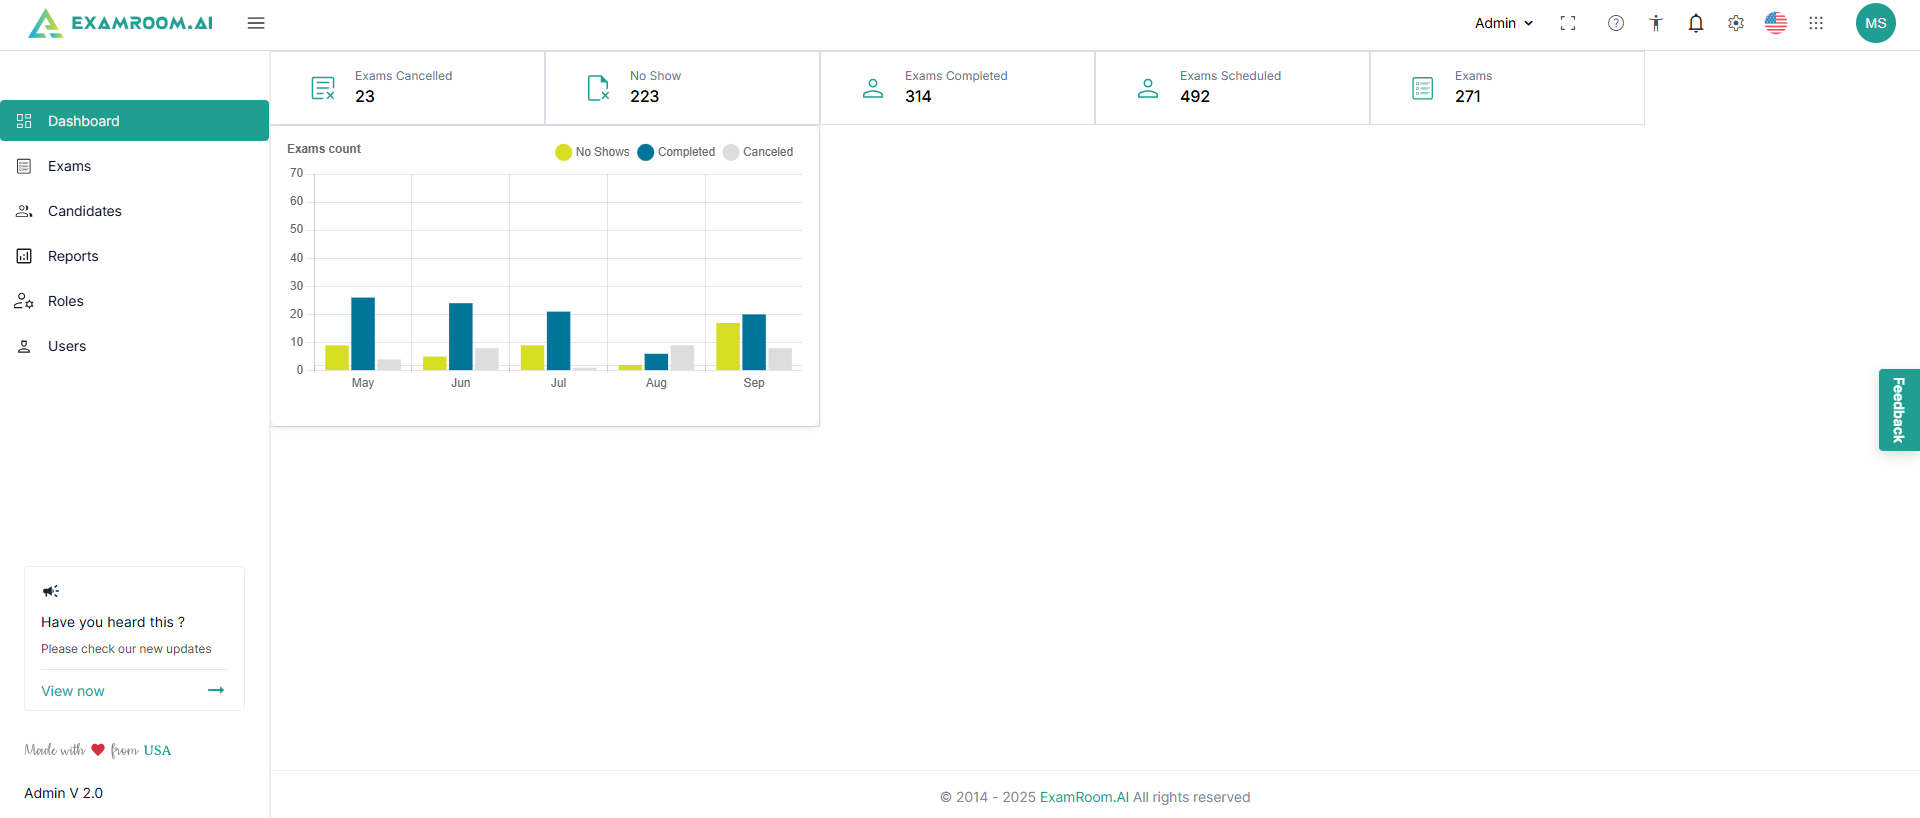
- The dashboard serves as the main landing page, displaying key information and preloaded insights and data. You can select the data in the graph to view the desired information.
- The fields in the Highlight Panel of the dashboard correspond to the application administration, having icons and descriptions described in the table below.
| Icon | Type | Description |
 | Zen mode | Click to give full-screen access and remove distractions. |
 | Help & Support | Click to view support details like walkthroughs, Technical Support, or help in sending feedback. |
 | Settings | Click to view additional functionalities that are not all part of the left navigation bar. |
 | Accessibility | Click to provide tactile reading and accessibility for all. |
 | Notifications | Click to see the alerts, reminders, and updates. |
 | Languages | Users switch between other languages, tailoring the console experience to their language preference. |
 | Multiple Product List | Users can explore our complete line of products using this icon. |
 | Profile | Enables efficient account management, with options to edit personal information, access help resources, and securely log out. |
- The left panel has the following information widgets for the users to select and view:
- Dashboard
- Exams
- Candidates
- Reports
- Roles
- Users
- The information bar at the top has the following details:
- Exams Canceled: The total count of the canceled exams
- No Show: Total count of exams, where candidates did not show up
- Exams Completed: Total completed exams
- Exams Scheduled: Total scheduled exams
- Exams: Total exams created

